Grid Statistics at our Energía Perpetua office location in El Limón.
March 2, 2025
Electrical grid availability February 2025
To enhance understanding of the electricity grid’s availability, as well as the frequency and duration of power outages, data on the electricity service at our office location in El Limón, Samaná, has been collected. The electricity service is supplied by El Progreso del Limón. See below for more information about the functional or technical background
It should be noted that the statistics provided are derived from actual data recorded at this specific location and grid connection; these figures may or may not reflect the experience of other service connections in El Limón or additional areas within the Samaná province.
Below table shows a monthly summary of the the availabilty in percentage, of time as well as some statistics on the outages within that month: how many outages recorded, the total duration of these outages, the average duration and the duration of the longest outage:
| Month | Availability% | Outages | Total Duration | Average | Longest |
|---|---|---|---|---|---|
| September 2024 | 90.7 | 18 | 1 day, 12:09:00 | 2:00:30 | 5:39:00 |
| October 2024 | 98.0 | 25 | 14:32:00 | 0:34:53 | 3:12:00 |
| November 2024 | 97.0 | 30 | 21:50:30 | 0:43:41 | 7:38:00 |
| December 2024 | 91.9 | 30 | 2 days, 11:55:00 | 1:59:50 | 8:34:00 |
| January 2025 | 99.0 | 38 | 7:31:00 | 0:11:52 | 2:57:00 |
| February 2025 | 96.3 | 39 | 23:51:30 | 0:36:42 | 10:08:00 |
| Average | 95.5 | 30.0 | 1 day, 3:18:10 | 1:01:15 | 6:21:20 |
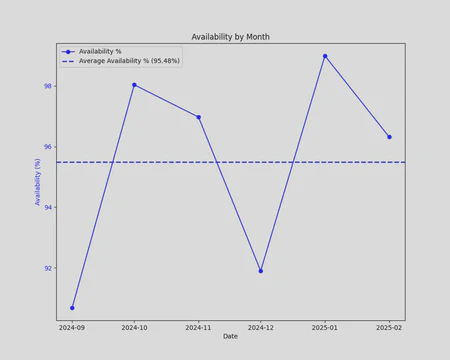
Availability Trend
Heat map of availabilty by day and time of day
This diagram shows the average availability percentage grouped by day of week and time of day. This allows to spot if there are patterns with reduced availability.
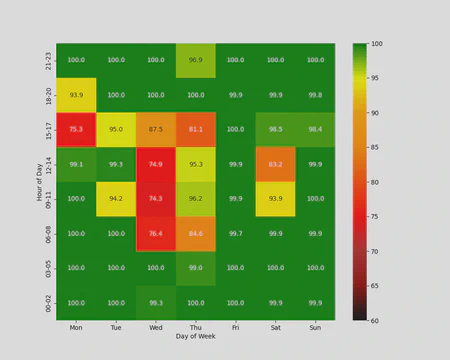
Availability Heatmap February 2025
Histogram of duration of the outages
This graph shows how often an outage with a certain duration happened. This is especially relevant to assess the impact of a power outage. As the duration of the outage gets longer, the impact may also get larger. In case a battery backup (UPS) is present, the capacity of the battery bank needs to be sufficient to bridge the outage for successful mitigation of the outage.

Outage Histogram February 2025
List of outages
This list has been filtered to only show the outages that lasted 15 minutes or more.
| Start | End | Duration |
|---|---|---|
| 2025-02-08 13:00:00 | 2025-02-08 15:10:00 | 02:10:00 |
| 2025-02-12 06:18:00 | 2025-02-12 16:26:00 | 10:08:00 |
| 2025-02-15 11:10:00 | 2025-02-15 11:54:00 | 00:44:00 |
| 2025-02-18 17:18:00 | 2025-02-18 17:54:00 | 00:36:00 |
| 2025-02-20 23:24:00 | 2025-02-20 23:46:00 | 00:22:00 |
| 2025-02-24 15:52:00 | 2025-02-24 18:44:00 | 02:52:00 |
| 2025-02-25 10:57:00 | 2025-02-25 11:30:00 | 00:33:00 |
| 2025-02-27 07:10:00 | 2025-02-27 09:27:00 | 02:17:00 |
| 2025-02-27 14:27:00 | 2025-02-27 17:16:00 | 02:49:00 |
Why this data?
Grid availability data provides valuable insights into the reliability and performance of the electricity supply, enabling the optimization of a Battery Energy Storage System (BESS) for homes or businesses. By analyzing outage frequency, duration, and timing, this data informs the precise determination of the BESS’s required battery capacity to ensure uninterrupted service during grid failures. Statistical evaluation of outage patterns helps calculate the minimum energy reserve needed to sustain critical loads, enhancing energy resilience and cost-efficiency by aligning the system with site-specific needs based on historical grid performance.
Furthermore, the BESS can be augmented with solar panels to charge the batteries during the day, maximizing energy independence and efficiency. This tailored approach, supported by empirical evidence, strengthens the case for investing in a BESS to improve energy security.
Technical background
To collect the data and generate the statistics and graphics, readings from a Shelly Pro 3EM 120A, connected to the main electricity supply, were utilized. The data is gathered by a Victron Energy Cerbo GX and logged at one-minute intervals in the Victron Energy VRM Cloud. A Python script retrieves the time-series data on the grid supply from VRM, detects outage events, generates various statistics, and renders graphs to visualize these statistics in multiple formats for presentation on this page.
Feel free to reach out for any questions of suggestions related to these statistics.